TABLE OF CONTENTS
I. Introduction
II. Publish
III. Get Link
IV. Recipient Tracking
V. Analysis
VI. Responses
VII. Export Responses & Analysis
Surveys can be shared with responders one of two ways.
-
Publication
-
Sends user-specific email notification linking to survey to desired recipients, from:
-
All users in a Boardable organization
-
All users in a Boardable group, or
-
Specific users in a Boardable organization

-
-
-
Get Link button
-
Copies a Survey link to the clipboard, to be shared with any responder, in or out of a Boardable organization
-
Publication cannot be used to send surveys to anyone who is not an admin and member in a Boardable organization.
Responses collected via publication automatically add the responder’s Boardable display name to their response.
These responses also update the survey’s recipient tracking, are counted in response analysis, and towards the completion rate.
Responses collected via the Get Link button do not automatically include responder names, update the survey’s recipient tracking, or count towards the completion rate. Instead, they can only be viewed in the Responses tab of the survey.
As such, using Get Link is a great option for anonymous surveys. If a survey should not be anonymous, please add a name question to the survey. Please also know that these responses will only be visible from the Responses tab of the survey page (and not from the Recipients tab).
These responses are counted in response analysis.
Each survey can only be published once. The recipient list cannot be modified after publication.
To share a survey via publication:
-
Click the title of your survey, opening its survey page
-
Select recipients
-
To send to all users in a Boardable organization, click the toggle labeled Send to everyone..., turning this on

-
To send to a specific group:
-
Click Choose list
-
Click View Boardable Groups
-
Click the title of the desired group

-
-
To send to specific users:
-
click into the text box labeled Type user...
-
Type the name of the desired recipient(s)
-
To save custom recipient list for future surveys:
-
Click + Create List
-
Set list name
-
Click Save

-
-
To update existing recipient list for future surveys:
-
Click + Create List
-
Click Update Existing
-
Use dropdown to select existing list to update
-
Choose either Add or Replace
-
Click Save

-
-
-
-
-
Click Publish
-
Choose between standard notification email body text (“You’ve been asked to fill out a survey”) and customized text
-
To customize notification email, tick checkbox labeled Add personalized message and type custom message in the text box this expands
-
-
-
Click Publish

To share a survey via the Get Link button:
-
Click the title of your survey, opening its survey page
-
Click Get link
-
Link is copied to clipboard

-
-
Share this link with desired participants by pasting in emails or other messages
Each survey tracks responses of publication recipients in the Recipient tab.
The following details are provided.
-
Number of publication recipients
-
Number of publication recipients who have completed their survey
-
The name of each publication recipient
-
The status of each publication recipient’s survey response, from Not Started or Completed
To view recipient tracking:
-
Click the survey title from the Surveys Homepage, opening this survey’s page
-
Page defaults to Recipients tab
-
-
Click Recipients at the top of the survey page to open this tab from another tab

-
Analysis Options
-
How to view analysis
The analysis tab of a survey page visualizes the data collected in surveys, per question.
Single-line input questions cannot be analyzed.
The following visualization options are supported for label and rating questions:
-
Histogram
-
Average
-
Gauge
-
Gauge chart displaying each answer along the rail, with slice extending to the average response

-
-
Bullet
-
Bullet chart displaying each answer along the line, with pointer extending to average response

-
-


The following visualization options are supported for checkbox and dropdown questions:
-
Chart
-
Bar chart displaying each response option along the Y Axis, and the number of responses along the X axis

-
-
Table
-
Table with the following columns
-
Answer
-
Response
-
Chart (bar chart reflecting the number of responders who selected this response)
-
Percentage (percentage of responders who selected this response)
-
Responses (number of responders who selected this response)

-
-
Text entries in Other (describe) responses for these question types are not included in the chart selected. However, these comments can be visualized in separate word clouds (see below).
The following visualization options are supported for multi-select dropdown questions, single-select dropdown questions, yes/no boolean questions, and ranking questions.
-
Bar
-
Bar chart displaying each answer along the Y axis, and number of responses along the X axis

-
-
Pie
-
Pie chart divided by answers, with each slice listing percentage of responders

-
-
Doughnut
-
Doughnut chart divided by answers, with each slice listing percentage of responders

-
Multi-select dropdown questions and ranking questions can also be visualized with a vertical bar chart.
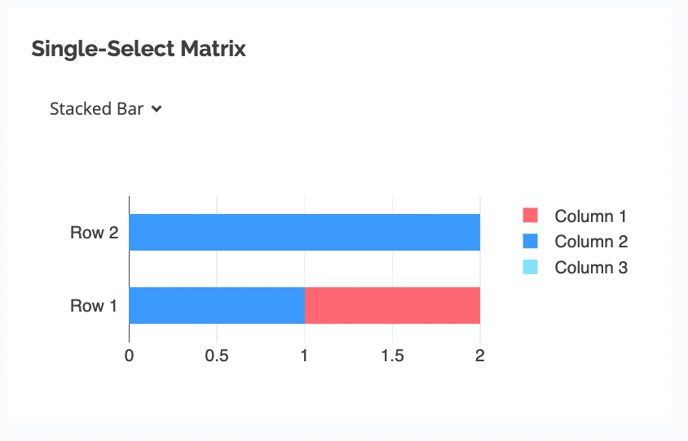
Single-select dropdown questions can also be visualized with a stacked bar chart, with responder answer selections layered.
The following visualization options are supported for text questions:
-
Word clouds

-
Text tables

To view analysis:
-
Click the title of your survey, opening its survey page
-
Click Analysis tab

-
Analysis provided for each question in panel, with default visualization options selected
-
To change visualization option, use dropdowns at top left side of question panels

-

The responder tab provides the following information:
-
Responder name (only filled for publication recipients)
-
Answers for each response by question
This information can be downloaded as a CSV file, or uploaded to a Boardable Document Center.
To view and download responses:
-
Click the title of your survey, opening its survey page
-
Click Responses tab

-
Responses are listed
-

The following exports are supported:
-
Responses CSV
-
CSV file containing the following details
-
Questions
-
Answers for each question
-
-
-
Analysis PDF
-
PDF file containing visualizations for each question in the survey as described in section V
-
In the analysis PDF, each question is allotted a complete page.
Each export can be downloaded to the exporter’s device, or uploaded to a Boardable Document Center folder via the Surveys interface. Exports cannot be added to the Document Center home; they must be nested in a folder.
To download responses or analysis to the device:
-
Click the title of your survey, opening its survey page
-
Click Export Results
-
Select between Export Analysis (PDF) or Export Responses (CSV)
-
Click Download instead

To add an export to a Boardable Document Center
-
Click the title of your survey, opening its survey page
-
Click Export Results
-
Select between Export Analysis (PDF) or Export Responses (CSV)
-
On the left side of the export menu, click the desired Document Center folder, filling in the checkbox next to this
-
Click Save


Related Articles
-
Edit & Delete Surveys: Learn how to edit and delete Boardable Surveys.
-
Build Surveys: Learn how to build Surveys.